Monthly Archives: January 2012

Breaking Baton Rouge Housing News: Case-Shiller Records 3.7% Annual Drop in Home Prices

https://batonrougehousing.wordpress.com/ – Breaking Baton Rouge Housing News: Case-Shiller Records 3.7% Annual Drop in Home Prices.

DSNews.com is reporting Case-Shiller Records 3.7% Annual Drop in Home Prices for the Case-Shiller Home Price National Index. The link to this news is here: http://www.dsnews.com/articles/case-shiller-records-continuing-declines-in-home-prices-2012-01-31.

Housing Market in Baton Rouge For January 2012

http://www.batonrougehousingreports.com/ – Week In Review In Baton Rouge Real Estate (Jan. 22-28, 2012). Housing numbers and interesting facts.

baton-rouge-real-estate-housing-numbers-studies

In this Baton Rouge Housing updating, January 22-28, 2012 are reported for the eight (8) parish MSA including East Baton Rouge, Ascension, Livingston and West Baton with Iberville, East and West Feliciana and Pointe Coupee combined as “ALL”.

Other Greater Baton Rouge Housing Statistics January 22-28:

LISTINGS:

Total Current Listings: 5,035

Foreclosure Listings: 490 or 10% of total listings

3rd Party Active Listings: 330 or 7% of total listings

Short Sale Active or Potential SS Listings: 250 or 5% of total listings

SOLDS From 01/22/2012 – 01/28/2012:

Total Number of Solds: 65

Foreclosures Sold: 14 or 22% of Solds

3rd Party Solds: 8 or 12% of total solds

Short Sales Solds: 8 or 12% of total solds

Foreclosure, 3rd Party and Short Sales Solds: 30 or 46% of all solds

Low To High Sales Prices: $16,000 to $475,000

New Home Sales: 18 or 28% of all sales

East Baton Rouge MLS Area with most home sales: 43 with 9 sales

CUMULATIVE TOTALS FOR 2012Total Number of Sales: 290

ASCENSION: 65
EAST BATON ROUGE: 149
EAST FELICIANA: 0
LIVINGSTON: 59
IBERVILLE: 2
POINTE COUPEE: 8
WEST BATON ROUGE: 6
WEST FELICIANA: 1

Foreclosures Sold: 69 or 24% of Solds

3rd Party Solds: 33 or 11% of total solds

Short Sales Solds: 47 or 16% of total solds

Foreclosure, 3rd Party and Short Sales Solds: 149 or 51% of all solds

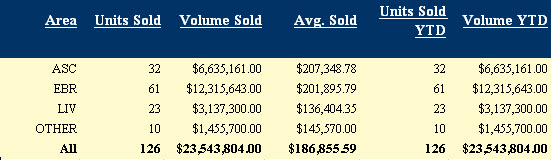
AVERAGE SALES PRICES FOR LOCAL PARISHES:
EAST BATON ROUGE: $192,043
ASCENSION: $190,747
LIVINGSTON: $144,439
OTHER: $158,993

MEDIAN SALES PRICES FOR LOCAL PARISHES:
EAST BATON ROUGE: $158,500
ASCENSION: $166,450
LIVINGSTON: $138,900
OTHER: $159,900

AVERAGE DAYS ON MARKET (CONTINUOUS):
EAST BATON ROUGE: 116
ASCENSION: 105
LIVINGSTON: 133
OTHER: 157

LISTING-TO-SALES PRICE RATIO (What Percent Below Listing Price Home Sell For):
EAST BATON ROUGE: 97%
ASCENSION: 99%
LIVINGSTON: 97%
OTHER: 92%

_____________________________________________________________________

Important Video: Foreclosure Mythbusting by John C. Jones

johncjones

_____________________________________________________________________

OTHER NATIONAL AND LOCAL HOUSING NEWS:

December Existing-Home Sales Show Uptrend

Investors With Cash Place Downward Pressure on Home Prices

Rise In Home Sales Signifies Strengthening Market: Economists

Weak December ends poor year for U.S. home building

Housing Crisis to End in 2012 as Banks Loosen Credit Standards

Absorption rates to improve across all property types in 2012

New mortgage originations drop 30% in November, loan delinquencies decline

December plunge leaves East Baton Rouge building permits down 3.5% in 2011

Report says B.R. housing is ‘moderately unaffordable’

Business Report Releases Baton Rouge’s 10 most expensive home sales of 2011

Juban Crossing Developer: Site work continues; deals with retailers in the works

Ascension Parish Real Estate Market Stats for December 2011

_____________________________________________________________________

NOTE: Based on information from the Greater Baton Rouge Association of REALTORS®\MLS for the period of 01/01/2012 to 01/28/2012. This information was extracted on 01/29/2012. Excludes Manufactured Housing.

Summerfield Subdivision Denham Springs 2011 Housing Numbers

https://batonrougehousing.wordpress.com/ – Summerfield Subdivision Denham Springs 2011 Housing Numbers. It used to be that homes in Summerfield sold in the $110/sf to $112/sf range. That was then and this is a new housing market in 2011.

Summerfield-Subdivision-Denham-Springs

Here are the Summerfield Subdivision housing numbers from end of December 2010 to end of December 2011. Average sales price was down from $192,380 in 2010 to $174,150 in 2011 or -9.5%. Median sales price was was down from $189,500 in 2010 to $175,000 in 2011 or -7.7%. However, the average sold price per sq. ft. was only down $2.42/sf or -2.45% from $98.58/sf to $96.16/sf.

Summerfield-Subdivision-Homes-Denham Springs-Home-Sales

Distressed Properties To Blame For Decline. I suspect part of this decline was due to 2 of the 5 total sales being 1 foreclosure and 1 short sale or 40% of total sales. And, Summerfield is simply correcting in price along with the remainder of Greater Baton Rouge Housing.

Denham Springs Summerfield Subdivision 2011 Comprehensive Housing Report. NOTE: Based on information from the Greater Baton Rouge Association of REALTORS®\MLS for the period of 01/24/2011 to 01/24/2012. This information was extracted on 01/24/2012.


Summerfield-Subdivision-Homes-Denham Springs

The statistics below are based on the same GBRMLS data and reveal totally different results, which may not be accurate based on the actual MLS chart above. Since there were no sales in December 2010 and December 2011, some of the data is incomplete.

Summerfield Subdivision Denham Springs LA 2011 Housing Reporthttp://www.scribd.com/embeds/79423707/content?start_page=1&view_mode=list&access_key=key-2deeudcw6dst692331s0
//

Denham Springs Westminister Estates 2011 Housing Report

http://www.batonrougehousingreports.com/ – Denham Springs Westminister Estates 2011 Housing Report. Average sold price declines 6.4% and average sold price per sq. ft. declines $10.43/sf.

Westminster-Estates-Denham-Springs-Entrance-Sign

The Legal Name of this development at the Livingston Parish Courthouse and in filing records is Westminister Estates, meaning the sign is wrong. Here are the Westminister Estates housing numbers from end of December 2010 to end of December 2011. Average sales price was down from $149,880 in 2010 to $140,293 in 2011 or -6.4%. Median sales price was basically unchanged. However, the average sold price per sq. ft. had a -$10.43/sf decline from $91.52 in 2010 to only $81.09/sf in 2011.

Foreclosures To Blame. I suspect part of this decline was due to 7 of the 15 total sales being foreclosures or 47% of total sales. This means that of the 15 total home sales, 7 were in some form of distress.

Westminster-Estates-Denham-Springs-Home-Sales


Denham Springs Westminister Estates Subdivision 2011 Comprehensive Housing Report. NOTE: Based on information from the Greater Baton Rouge Association of REALTORS®\MLS for the period of 01/16/2011 to 01/16/2012. This information was extracted on 01/16/2012.

11340 Windsor Avenue Denham Springs LA 70726 Westminister Estates


The statistics below are based on the same GBRMLS data and reveal totally different results, which may not be accurate based on the actual MLS chart above.

Dec-10 vs. Dec-11: The median sold price is down 11%

Dec-10 vs. Dec-11: The median price of for sale properties is up 3% and the median price of sold properties is down 11%

Dec-10 vs. Dec-11: The number of Sold properties has not changed

Dec-10 vs. Dec-11: The number of Under Contract properties is down 100%

Dec-10 vs. Dec-11: The number of New properties is down 50%

Dec-10 vs. Dec-11: The number of For Sale properties is down 44%

Dec-10 vs. Dec-11: The number of Expired properties is down 100%

Dec-10 vs. Dec-11: The number of for sale properties is down 44% and the number of sold properties has not changed

Dec-10 vs. Dec-11: The average days on market is down 100%

Dec-10 vs. Dec-11: The average months supply of inventory is down 100%


Denham Springs Westminister Estates Subdivision 2011 Comprehensive Housing Reporthttp://www.scribd.com/embeds/79302431/content?start_page=1&view_mode=list&access_key=key-2mylrqte5rxfp9vuh9m8
//

Baton Rouge Broadmoor Subdivision 2011 Comprehensive Housing Report

http://batonrougehousingreports.com/ – Baton Rouge Broadmoor Subdivision 2011 Comprehensive Housing Report. Broadmoor home prices decline or corrects in 2011 close to 10%.

Broadmoor-Subdivision-Entrance-Baton-Rouge


Here is the report on Broadmoor Subdivision housing numbers based on 58 home sales from end of December 2010 to end of December 2011. Note: This was a search through ALL of the Single Family Homes Broadmoor Subdivisions in GBRMLS, not just “Broadmoor Subd”. From 2010 to 2011, the Average sold price declined from $169,689 to $153,349 or -9.6%. From 2010 to 2011, the Median sold price declined from $166,000 down to $150,500 or -9.3%. From 2010 to 2011, the average sold price per sq. ft. declined from $77.93 down to $69.65 or -$8.28/sf or -10.7%. The percentage of distressed sales jumped from 17% in 2010 to approximately 36% in 2011.

Solds In Broadmoor from 1/1/2010 to 12/31/2010 revealed:
Average Sales Price: $169,689
Average Sold Price Per Sq. Ft.:$77.93/sf
Median Sold Price: $166,000
Low To High Sales Prices: $85,000 to $259,950
Number of Sales: 59
Number of Sold Distressed REO/Foreclosures/3rd Party/Short Sales Noted: 10 or 17%

Solds In Broadmoor from 1/1/2011 to 12/31/2011 revealed:
Average Sales Price: $153,349
Average Sold Price Per Sq. Ft.:$69.65/sf
Median Sold Price: $150,500
Low To High Sales Prices: $63,000 to $316,000
Number of Sales: 58
Number of Sold Distressed REO/Foreclosures/3rd Party/Short Sales Noted: 21 or 36%

Distressed Sales To Blame For Declines? Yes! I suspect part of this decline was due to the generall overall housing correction taking place in Baton Rouge and 21 or 36% of the 58 total sales being distressed in some form compared to only 10 or 17% in 2010. This means that of the 58 total home sales, 21 or 36% were in some form of distress, which is very high for the Baton Rouge housing market.

Broadmoor Subdivision 2011 Comprehensive Housing Report. NOTE: Based on information from the Greater Baton Rouge Association of REALTORS®\MLS for the period of 01/16/2011 to 01/16/2012. This information was extracted on 01/16/2012. Yes, this appraiser does have permission to use the subdivision chart above.

9556 Goodwood Blvd Baton Rouge LA 70815

The statistics below are based on the same GBRMLS data and reveal totally different results, which may not be accurate based on the actual MLS chart above.

Dec-10 vs. Dec-11: The median sold price is down 8%

Dec-10 vs. Dec-11: The median price of for sale properties is up 8% and the median price of sold properties is down 8%

Dec-10 vs. Dec-11: The number of Sold properties is up 300%

Dec-10 vs. Dec-11: The number of Under Contract properties has not changed

Dec-10 vs. Dec-11: The number of New properties is down 62%

Dec-10 vs. Dec-11: The number of For Sale properties is down 16%

Dec-10 vs. Dec-11: The number of Expired properties is down 71%

Dec-10 vs. Dec-11: The number of for sale properties is down 16% and the number of sold properties is up 300%

Dec-10 vs. Dec-11: The average days on market is down 24%

Dec-10 vs. Dec-11: The average months supply of inventory is down 8%

Baton Rouge Broadmoor Subdivision 2011 Comprehensive Housing Reporthttp://www.scribd.com/embeds/79303030/content?start_page=1&view_mode=list&access_key=key-5y6svat33lneko67cqv
//

Week In Review In Baton Rouge Real Estate (Jan. 15-21, 2012)

http://www.batonrougehousingreports.com/ – Week In Review In Baton Rouge Real Estate (Jan. 15-21, 2012). Housing numbers and interesting facts.

baton-rouge-real-estate-housing-numbers-studies

In this Baton Rouge Housing updating, January 15-21, 2012 are reported for the eight (8) parish MSA including East Baton Rouge, Ascension, Livingston and West Baton with Iberville, East and West Feliciana and Pointe Coupee combined as “ALL”. This chart below represents January 1-15, 2012.

greater-baton-rouge-home-sales-january-1-15-2012

Other Greater Baton Rouge Housing Statistics January 15-21:

Total Current Listings: 4,931 as of 01/21/2012

Total Solds: 52

Foreclosure Listings: 488 or 10% of total listings

Foreclosures Sold: 14 or 27% of Solds

3rd Party Active Listings: 323 or 7% of total listings

3rd Party Solds: 3 or 6% of total solds

Foreclosure and 3rd Party Solds: 17 or 33% of all solds

Low To High Sales Prices: $26,900 to $905,000

Home Below is the $905,000 sale in University Club Plantation

3114 Coates Crossing Baton Rouge LA 70810 University Club Plantation Subd


New Home Sales: 13 or 25% of all sales

_____________________________________________________________________

Important Video: Warren Buffet’s Real Estate CEO on Housing Fix – CNBC

Good Outlook, Pent up Demand, Rents Becoming Equal To or Exceeding House Payments Becoming “Tipping Point” for buyers to buy housing if they qualify.

baton-rouge-housing-improving

_____________________________________________________________________

RE/MAX Chairman Named Most Influential Real Estate Leader 2011

_____________________________________________________________________

OTHER HOUSING NEWS:

Business Report and The Advocate report Baton Rouge home sales up 3% in 2011


_____________________________________________________________________

NOTE: Based on information from the Greater Baton Rouge Association of REALTORS®\MLS for the period of 01/01/2012 to 01/21/2011. This information was extracted on 01/22/2012. Excludes Manufactured Housing.

On Moving to Baton Rouge

This is sweet reminiscing about good ol’ Baton Rouge.

The McClusky Journals

I just talked to an old, dear friend whose beautiful and talented daughter has just has accepted her first job in Baton Rouge, Louisiana.  This takes me back, way back.  My very first apartment was in Baton Rouge. just outside the gates of LSU at the corner of State Street and Ivanhoe.  I was nineteen and full of myself.  And although I was not a student, I regularly crashed the LSU classes in which I had an interest.  I found the South Louisiana countryside to be romantic and enchanting.  And I partied my ass off.  Cajun Country is a wonderful world all its own.

So it is with strong affection and nostalgia that I offer my little friend, and any other young people moving to Baton Rouge, the following words of advice:

  • Make sure that you know and understand the marijuana laws;
  • Be nice to the police officers;
  • Never suck…

View original post 90 more words

What Does Short Sale Mean?

Explanation of a short sale!

Local Motion

As the real estate market remains volatile, one of the best options for many new home buyers is purchasing a short sale home. But, what does “short sale”  mean? A short sale is when lenders have the opportunity to sell a property before the bank forecloses on the home rather than after. While buying short sales creates the opportunity for real estate investors to pay well-below-average housing prices for properties within ideal locations, there are still drawbacks.

If you’re interested in buying short sales, here are a few things you need to be aware of:

Why Banks Short Sale Pre-Foreclosure Homes

The last thing a bank wants to do is own a property secured by the bank’s loans. When a property owner is in default and owes more than what the home is currently worth, the bank will work with the seller to offer the property for less than they…

View original post 463 more words